
Choose the load
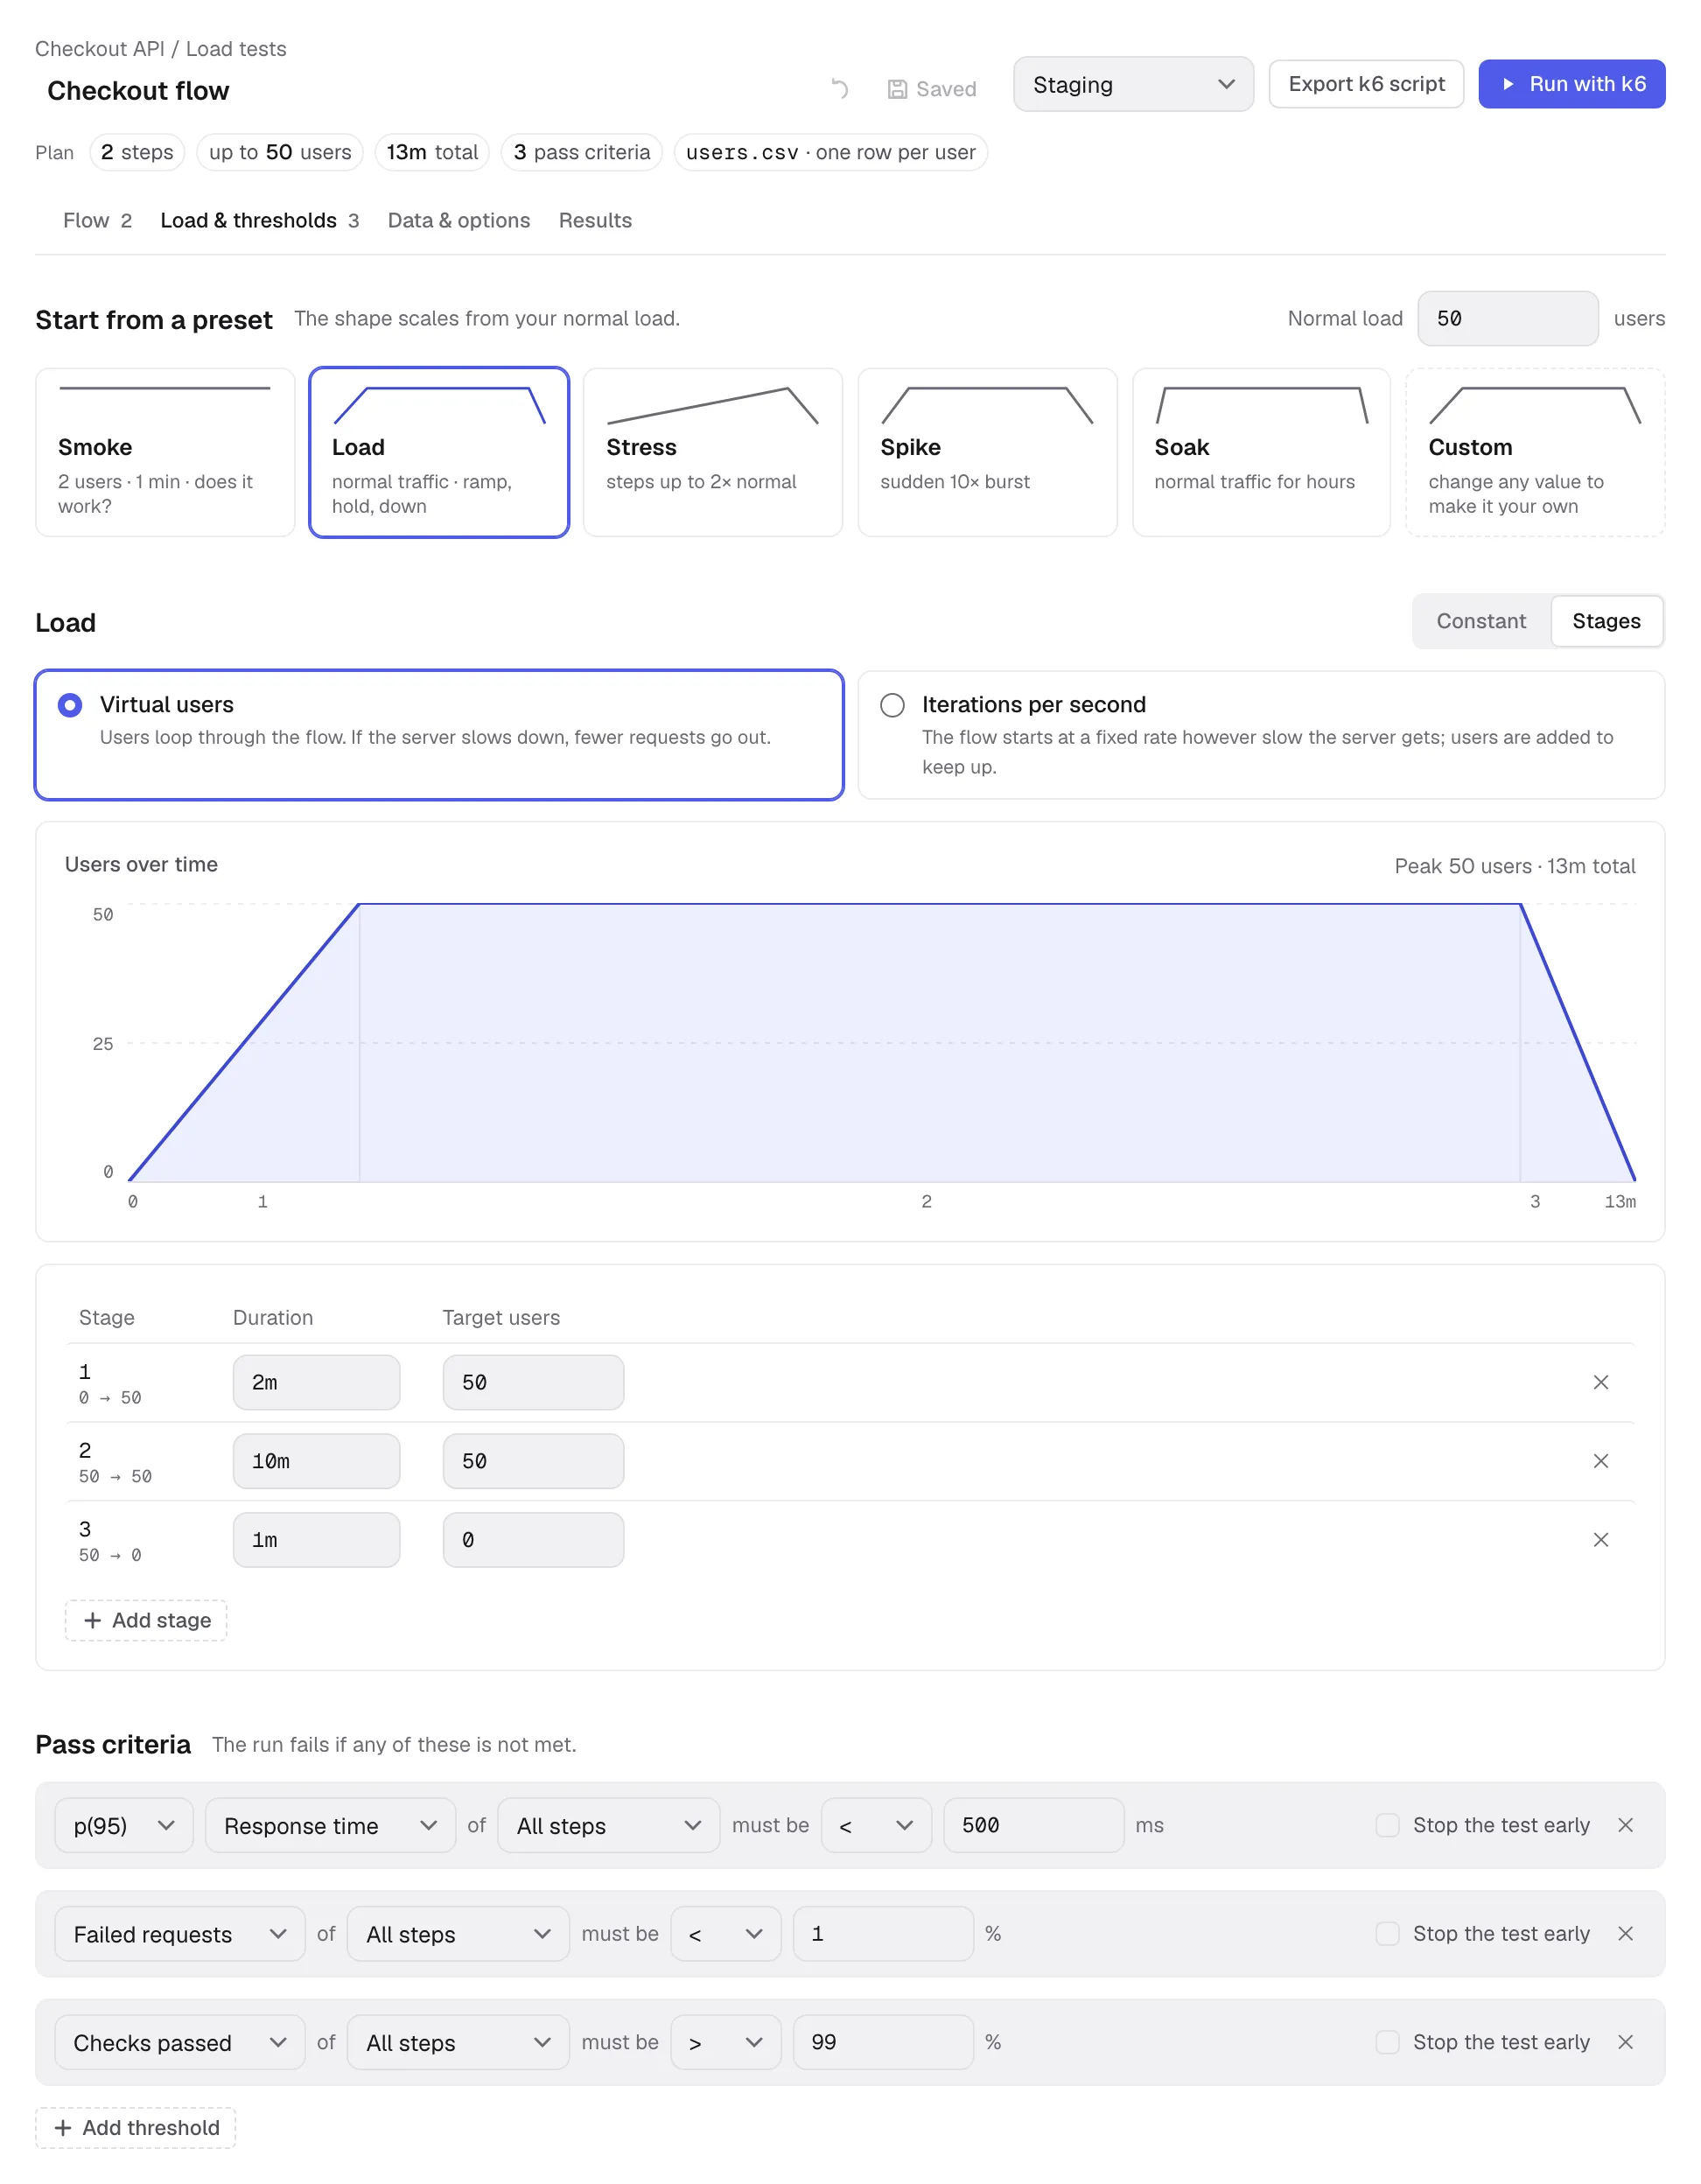
Open Load & thresholds. Set Normal load and pick a preset — each card shows the shape it applies — then adjust its duration or stages. The test stores only the resulting load, not the preset’s name: a card stays highlighted while the settings match that preset exactly, and Custom is highlighted as soon as you change a value. The chart shows the planned load over time; hovering or editing a stage highlights its part of the chart. Applying a preset replaces the load profile; it keeps your flow, checks, data and thresholds.
| Preset | Starting profile |
|---|---|
| Smoke | 2 users for 1 minute |
| Load | Ramp to normal load over 2 minutes, hold for 10 minutes, ramp down over 1 minute |
| Stress | Four 3-minute stages at 50%, 100%, 150% and 200% of normal load, then a 2-minute ramp down |
| Spike | Ramp to 10× normal load over 10 seconds, hold for 1 minute, ramp down over 10 seconds |
| Soak | Ramp up over 5 minutes, hold for 2 hours, ramp down over 5 minutes |
Users or iterations per second
Section titled “Users or iterations per second”Virtual users keeps a chosen number of VUs busy. Each user starts its next iteration after finishing the previous one, including waits. Slower responses mean fewer completed iterations per second.
Iterations per second starts whole flow iterations at the target rate. This is not a request-per-second target: one iteration may send several requests. The Smoke preset in this model starts two iterations per second for one minute.
Both models support a constant load or stages. Their k6 executors are constant-vus, ramping-vus, constant-arrival-rate and ramping-arrival-rate. For arrival-rate tests, set the preallocated users and maximum users high enough to sustain the target rate; k6 may need more users when responses slow down. The preview shows the planned profile, not measured traffic.
Decide whether a run passes
Section titled “Decide whether a run passes”Add thresholds under the load profile. Each reads as a sentence, such as p(95) Response time of All steps must be < 500 ms, and applies to All steps or one selected step:
| Metric | Example | Meaning |
|---|---|---|
| Response time | p(95) < 500 ms | The 95th-percentile request duration stays below 500 ms |
| Failed requests | < 1% | Fewer than 1% of requests are counted as failed by k6 |
| Checks passed | > 99% | More than 99% of checks pass |
Response-time statistics include median, average, minimum, maximum, p90, p95 and p99. The UI uses milliseconds for durations and percentages for rates. In YAML and k6 scripts, rates use fractions: 1% becomes 0.01.
A failed threshold makes the run Failed, even if the process finishes normally. Enable Stop the test early to let k6 stop a run when that threshold fails. A failed check and a failed HTTP request are separate metrics; set thresholds for both when both matter to your test.